My First Blog
VIZbyArcher - 25 Aug 2019
Now I can start writing about something.
First let’s insert a link to some 920 pixel wide Page.
Another link to some 920 pixel wide Page.
Then let’s insert a link to some 640 pixel wide Page.
And finally another link to a Page.
For fun, check this animation: 
Or this: 
And this link.
This is a test for legend text adjustment: link.
Now let’s see an image linking to a test page:
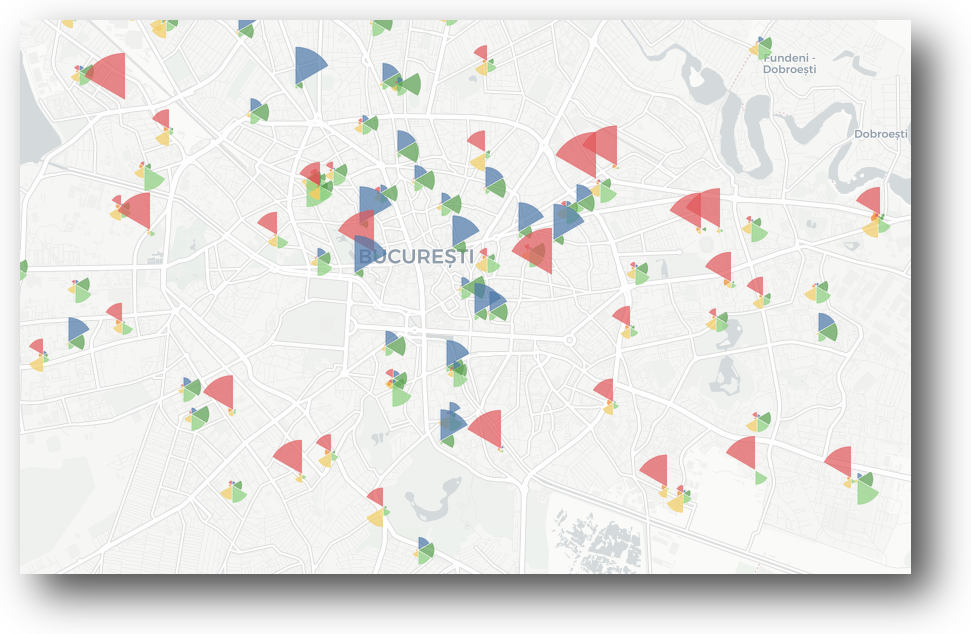
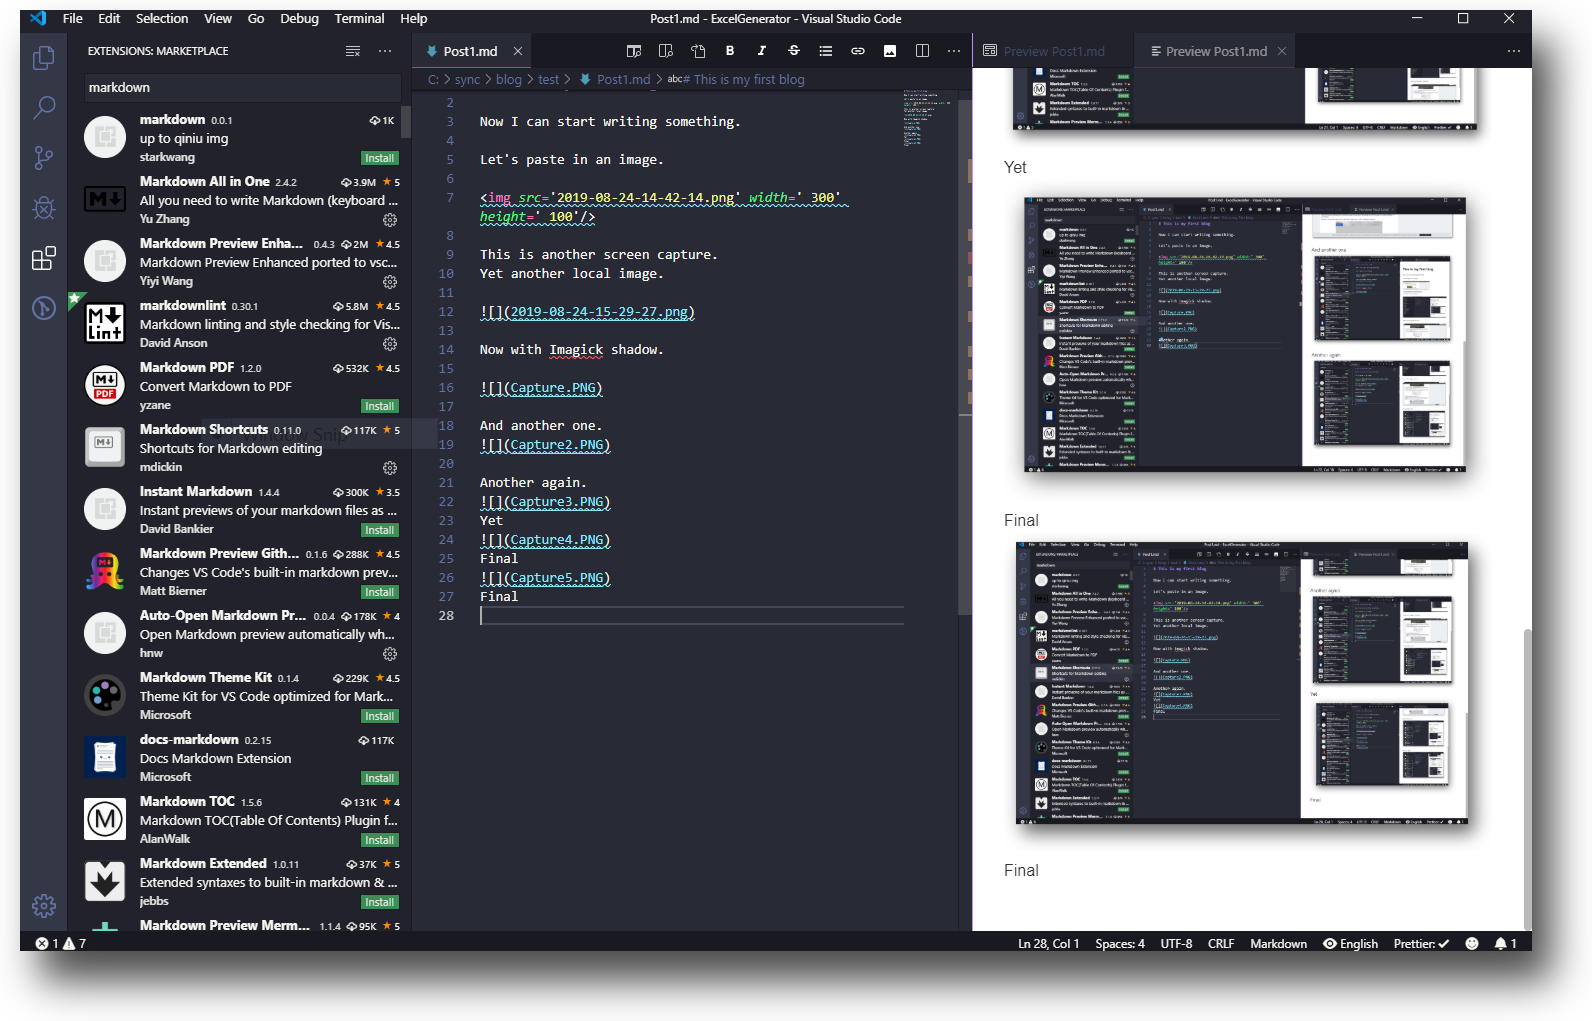
Let’s paste in another image.
This is a test for a tile map based on CSS grid.
HTML source code
<img src="2019-08-24-21-23-57.png" width=" 450" height=" 300" />
This should be a very very very long paragraph in order to test paragraph reflowing and warp text settings for both desktop and mobile versions of the same page.
Code block with line numbering
1
2
3
4
5
6
7
8
9
10
11
12
13
14
15
16
17
18
19
20
21
22
23
24
25
26
27
28
29
30
31
32
33
34
35
36
37
38
39
40
41
42
43
44
45
46
47
48
49
50
51
52
53
54
55
56
57
58
59
60
61
62
63
64
65
66
67
68
69
70
71
72
73
74
75
76
77
78
79
80
81
82
83
84
85
86
87
88
89
90
91
92
93
94
95
96
97
98
99
100
101
102
103
104
105
106
107
108
109
110
from bokeh.layouts import column, row
from bokeh.models import ColumnDataSource, Slider, WheelZoomTool, PanTool, HoverTool, ColumnDataSource, Slider, WheelZoomTool, PanTool, HoverTool, ColumnDataSource, Slider, WheelZoomTool, PanTool, HoverTool
from bokeh.plotting import Figure, output_file, show
from bokeh.layouts import widgetbox, gridplot
from bokeh.models.widgets import Select, DataTable, DateFormatter, TableColumn, CheckboxGroup, Div, MultiSelect, \
    RangeSlider, Div, PreText
from bokeh.models.widgets import Panel, Tabs
from bokeh.io import export_svgs, export_png
from bokeh.models import DatetimeTickFormatter, FuncTickFormatter, Range1d, LabelSet, Label, DataRange1d, FactorRange
from bokeh.models import SingleIntervalTicker, LinearAxis, CategoricalAxis
from bokeh.models import LinearColorMapper, BasicTicker, PrintfTickFormatter, ColorBar
from bokeh.models.callbacks import CustomJS
from bokeh.models import Arrow, OpenHead, NormalHead, VeeHead
from bokeh.models.annotations import Title
from bokeh.models.markers import Circle
from bokeh.models.glyphs import Line
from bokeh.transform import linear_cmap
from bokeh.resources import CDN
from bokeh.embed import file_html
import pandas as pd
import locale
import datetime
import pprint
import numpy as np
import time

# https://gka.github.io/palettes/
# https://stackoverflow.com/questions/40158529/pass-variables-from-bokeh-to-js-via-customjs?rq=1
# https://developer.mozilla.org/en-US/docs/Web/JavaScript/Reference/Global_Objects/Object/entries

start = time.time()
# pprint.pprint(locale.locale_alias)
# print(time.strftime('%A'))
# print(locale.getlocale(locale.LC_TIME))
# locale.setlocale(locale.LC_TIME, 'romanian')
# print(locale.getlocale(locale.LC_TIME))
# print(time.strftime('%A'))


# Import and clean input dataset:

df = pd.read_csv('exportPivot.csv', index_col=0)
print(df.columns)
df.reset_index(inplace=True)
df.replace(':', '', inplace=True)
# print(df.head())
df.columns = df.columns.str.strip()
df['Ani'] = df['Ani'].str.replace(r' [a-zA-Z]*', '')
# df['Ani'] = pd.to_datetime(df['Ani'], infer_datetime_format=True)
# df['Ani'] = pd.DatetimeIndex(df['Ani']).year
df.rename(index=str, columns={
          'Macroregiuni  regiuni de dezvoltare si judete': 'Categorii'}, inplace=True)
df.drop('UM: Numar de persoane condamnate definitiv la 100000 locuitori',
        axis=1, inplace=True)
print(df.columns)


# Make some general variables for dataset:

datasetrk = 1  # dataset parameter
# 1: Lower is better, ascending order for ranking
# 0: Higher is better, descending order for ranking
colorbetter = '#2c7bb6'
colorworse = '#d7191c'
colorsworse = ['#fff0ae', '#ffe6a6', '#fedd9d', '#fed395', '#fdc98d', '#fcc085', '#fab77d', '#f9ac75', '#f7a26d', '#f59865',
               '#f38e5d', '#f08456', '#ee7a4e', '#eb6f47', '#e8653f', '#e55938', '#e24d31', '#de402a', '#db2f23', '#d7191c']
colorsbetter = ['#fff0ae', '#f6e9af', '#ece3b0', '#e4ddb1', '#dbd6b1', '#d2cfb2', '#c8c9b3', '#bfc3b3', '#b6bdb4', '#acb6b4',
                '#a3b0b4', '#98aab5', '#8da4b5', '#839db5', '#7797b6', '#6c92b6', '#608cb6', '#5287b6', '#4180b6', '#2c7bb6']
if datasetrk == 1:
    colors = colorsworse
else:
    colors = colorsbetter

iqrlimit = 3
upper = df.Valoare.quantile(0.75) + iqrlimit * (df.Valoare.quantile(0.75) - df.Valoare.quantile(0.25)) + iqrlimit * (
    df.Valoare.quantile(0.75) - df.Valoare.quantile(0.25)) + iqrlimit * (df.Valoare.quantile(0.75) - df.Valoare.quantile(0.25))
lower = df.Valoare.quantile(
    0.25) - iqrlimit * (df.Valoare.quantile(0.75) - df.Valoare.quantile(0.25))
print(lower, upper)

if df.Valoare.max() > upper:
    highlimit = upper
else:
    highlimit = df.Valoare.max()
if df.Valoare.min() < lower:
    lowlimit = lower
else:
    lowlimit = df.Valoare.min()
print(lowlimit, highlimit)
mapper = LinearColorMapper(palette=colors, low=lowlimit, high=highlimit)

periods = df.Ani.unique()
periods.sort()
# print(periods)
categories = df.Categorii.unique()
categories.sort()
# print(categories)
categories2 = list(df.Categorii.unique())
categories2.sort()
categories2.insert(0, '-')

setmin = df.Valoare.min()
setmax = df.Valoare.max()
if setmax*setmin < 0:
    setheight = setmax - setmin
elif setmax > 0:
    setheight = setmax
else:
    setheight = -setmin
print('set height (data points) is:', setheight)
Code block without line numbering
# Ruby code with syntax highlighting
GitHubPages::Dependencies.gems.each do |gem, version|
  s.add_dependency(gem, "= #{version}")
end
Table Example
head1 | head two | three ——-|———–|—— ok | good fried fish | nice out of stock | good and plenty | nice ok | good biscuits | hmm ok | good soup drop | yummy