Projects
-
Financial Results Reporting: Beyond Text Tables
Financial statements presentation can be much more than formatted Excel tables.
-
Geospatial Analysis For Retail Network Optimization
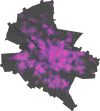
Is this convenience store in downtown hurting foot traffic and sales at the superstore 500 meters away? Or is it doing the opposite — attracting new customers and making them more likely to visit both stores? How are these five stores located over a common 10,000 m2 area affecting their revenues? If a new superstore will be opened one street away from a major hypermarket, what impact will it have on sales? The answers to these kinds of questions are increasingly crucial to a retailer’s success and guessing wrong can lead to lost sales and expensive real-estate-investment mistakes.
-
Time Series: Interactive Exploratory Data Analysis
Visual representation of Time Series is one of the most common forms of usage of data visualisation.