Geospatial Analysis For Retail Network Optimization
Is this convenience store in downtown hurting foot traffic and sales at the superstore 500 meters away? Or is it doing the opposite — attracting new customers and making them more likely to visit both stores? How are these five stores located over a common 10,000 m2 area affecting their revenues? If a new superstore will be opened one street away from a major hypermarket, what impact will it have on sales? The answers to these kinds of questions are increasingly crucial to a retailer’s success and guessing wrong can lead to lost sales and expensive real-estate-investment mistakes.
Unfortunately, retailers often make the wrong decisions about which stores to close, thus inadvertently hurting their business further. They also overlook valuable opportunities to expand its market presence and unlock growth. The main reason is that they’re using outdated metrics: many retailers continue to use a combination of trend analysis and “four-wall economics” to assess store performance — that is, they’re still primarily taking into account the sales and profits that the store generates within its four walls, without considering its impact on other channels. This assessment then affects other decisions, including the store’s payroll, labor coverage, and sometimes inventory selection.
The combination of advanced geospatial techniques is unleashing powerful new insights for retailers. In particular, it’s helping retailers make better decisions about expanding or contracting their store networks. It’s also helping them develop store-level action plans to improve performance. Besides, some retailers are using these insights to mobilize their sales force and prioritize their investments.
Geospatial analysis is an approach to applying statistical analysis and other analytic techniques to data which has a geographical or spatial aspect. This usually means data on imagery, GPS, satellite photography and historical data, that can be used to describe exact geographic coordinates or build a picture of an area in terms of a street address, postal code or any other identifiers, as they are applied to geographic models.
Geospatial analytics in action: Mega Image Network in Bucharest
Mega Image is a supermarket chain, established in Bucharest, Romania in 1995. Mega Image is currently owned by Ahold Delhaize, a Dutch-Belgian retail company, operating supermarkets and e-commerce businesses. In Romania, Mega Image chain operates over 700 stores in 11 counties. Bucharest network of Mega Image includes 466 stores as of September 2019.
Using store location from Mega Image website we have assembled a list of all addresses and geocoded them to gather all geographical coordinates of the stores. Using these coordinates to plot store locations on ©Thunderforest OCM Public Transport map for Bucharest area (based on ©OpenStreetMap contributors data), some clusters and blind spots easily reveal themselves.
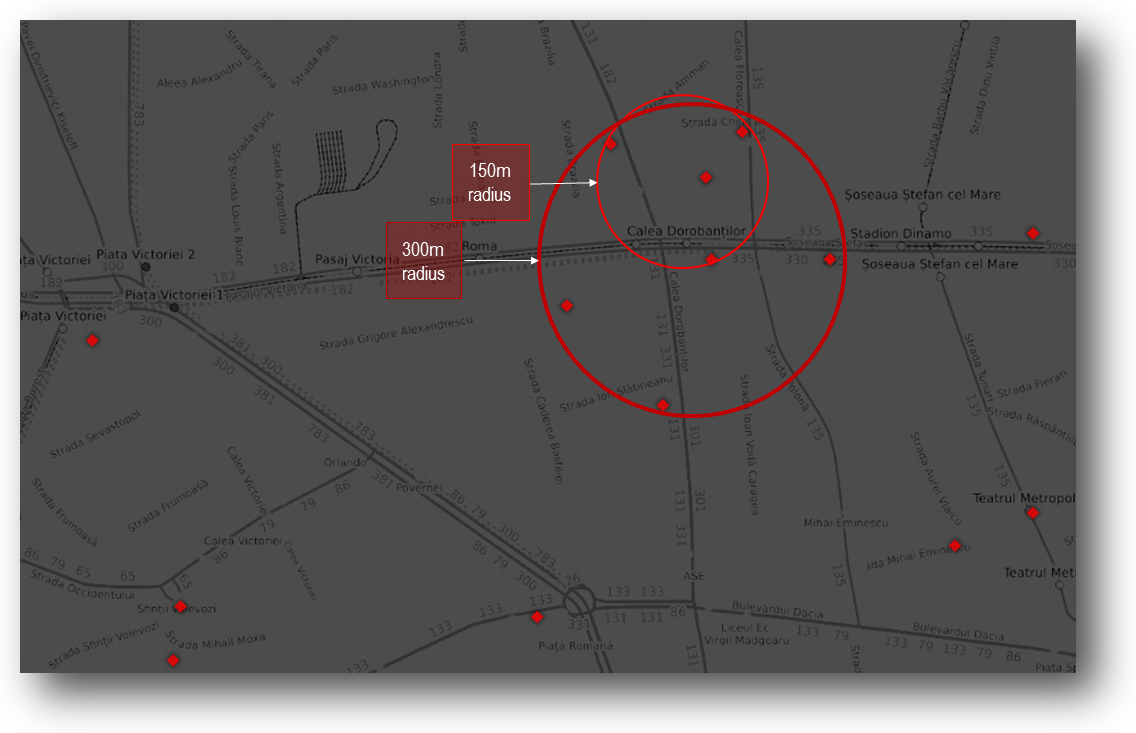
 Zooming in on Dorobanti - Stefan cel Mare cross-road, such a cluster can be seen in more detail. There are 4 stores in a 150 meters radius circular area, and 7 stores in a 300 meters radius circular area.
Target Area based on Geometric Distance
To asses the reachability of each store location, individual Target Area (sometimes also called Catchment Area) should be computed for each pair of coordinates.
The simplest form of target area computation is based on geometric distance, where the area of a store is defined as the sum of all points that are closer to that specific store location than to any location of other stores. In terms of efficiency of the network, the surface of a Target Area is having a high significance, as too large areas mean that customers should travel more to reach the store that is closest to them, and too small areas means that a smaller number of potential customers live are closest to that particular store (as opposed to any other store).
Population Density Mapping
The simple geographical placement of stores or geometric target areas is not enough to produce significant insights into the efficiency of a retail network. Any relevant geospatial analysis should be based on region demographics, at the most granular level available, to be able to visually translate surface into density.
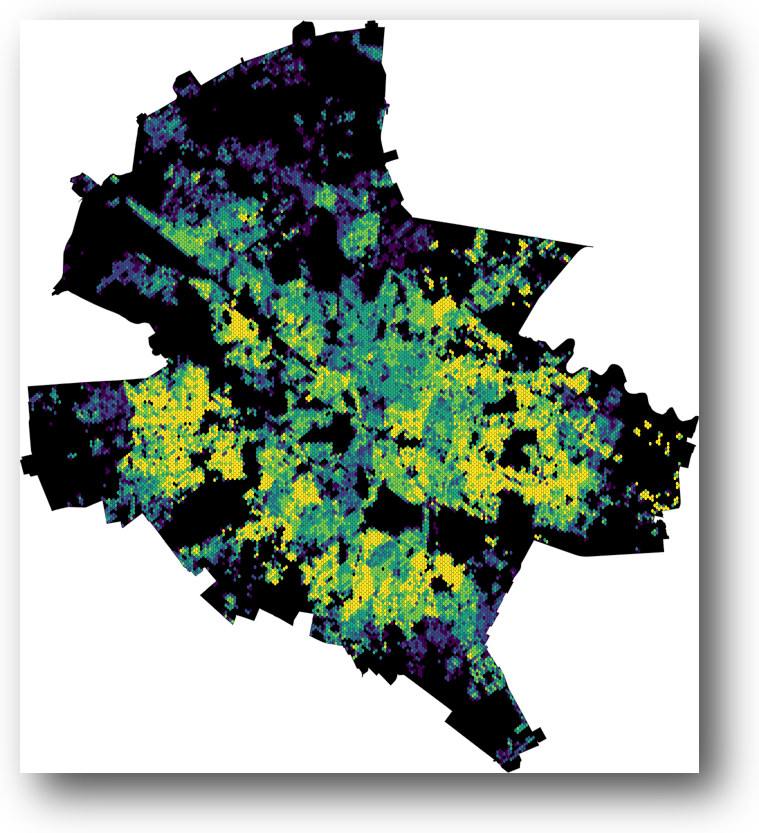
Using public data we are currently developing a proprietary Spatial Density of Population Model, accounting for the distribution of adult population in Bucharest, using a hexagonal bin representation of density.
Color legend: dark violet - low density, green - medium density, yellow - high density.
 For a downloadable high-quality version of the Spatial Density of Population - Bucharest map, click here (19 MB image file size).
Going back to Dorobanti area example, zooming in on population density map we can see now the proper context to understand how the placement of several stores over a narrow area is correlating with adult population density (hint: it isn’t! Dorobanti cluster is not on top of a large yellow area, therefore number of potential customers served is average at best).
Target Areas based on Isochrones
To improve the quality of the target areas analysis, we should model the areas not based on mere geometric distance but on a more sophisticated, streets walking aware, method called topological distance. An isochrone area is an area from where, one can travel in a given time to the destination point (and vice versa, the maximum area that can be reached by someone leaving the origin point, in the given time). The destination/origin point is the center of the isochrone area. So traveling from point A to point B is not a straight line (as assumed in the geometric distance) but a multi-edges path, taking into account the exact topology of the streets network, crossings, and obstacles.
For our purpose, an isochrone area of X minutes will represent the sum of all points from the city where/from where one can travel from/to the target point (i.e. store location) in up to X minutes of walking time.
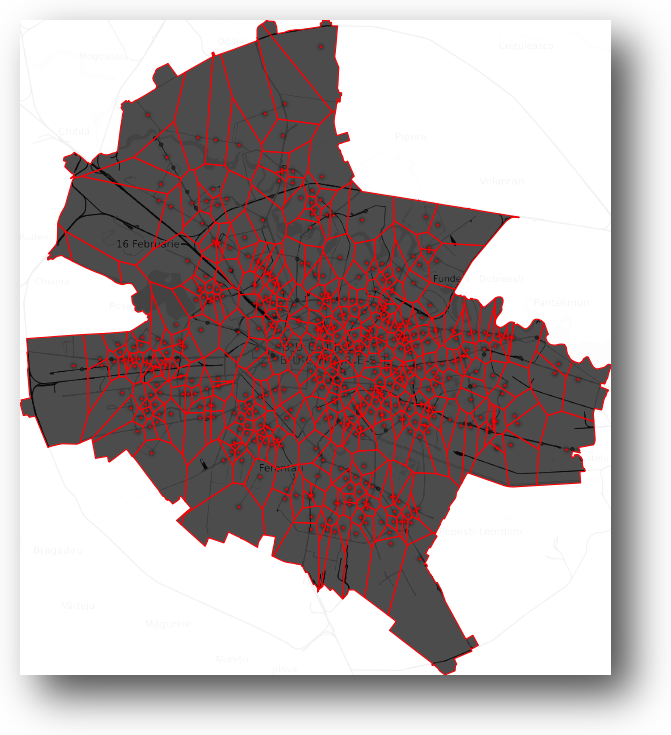
To be able to compute isochrone areas, a detailed streets network has to be used, as such in the following image (containing all OpenStreetMap data for Bucharest).
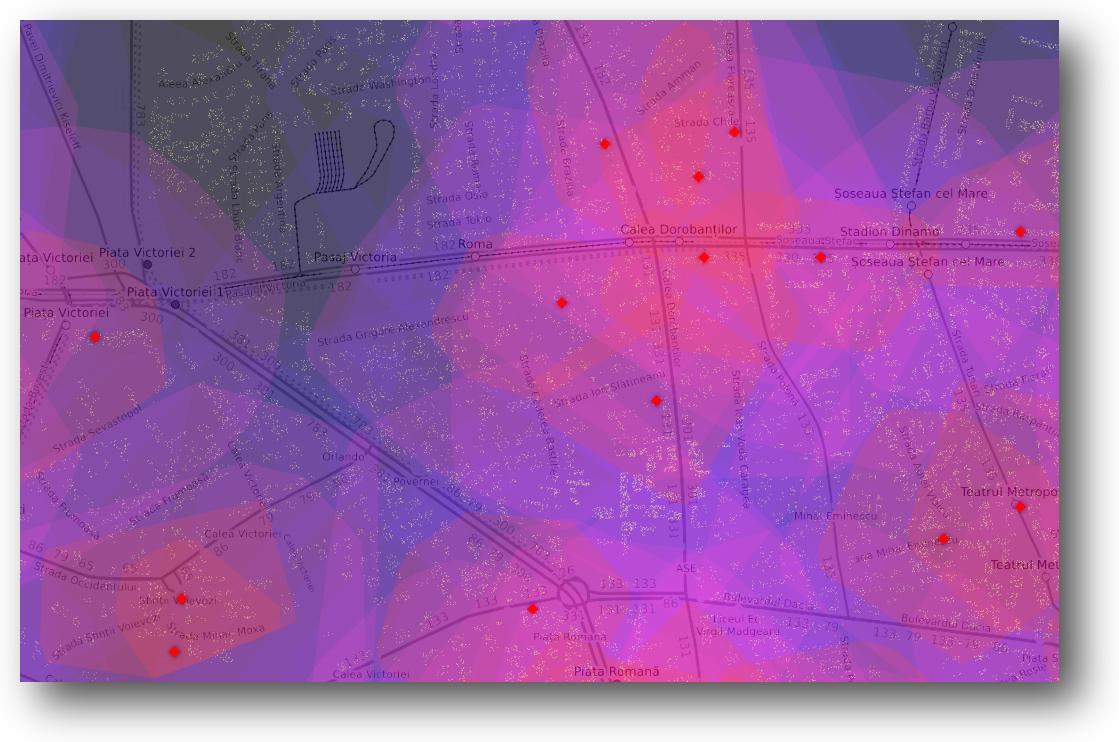
 We have used 3 minutes (colored in red), 6 minutes (colored in violet) and 9 minutes (colored in blue) walking time isochrones, to emulate a detailed target area for a superstore/convenience store appropriate for Mega Image network analysis.
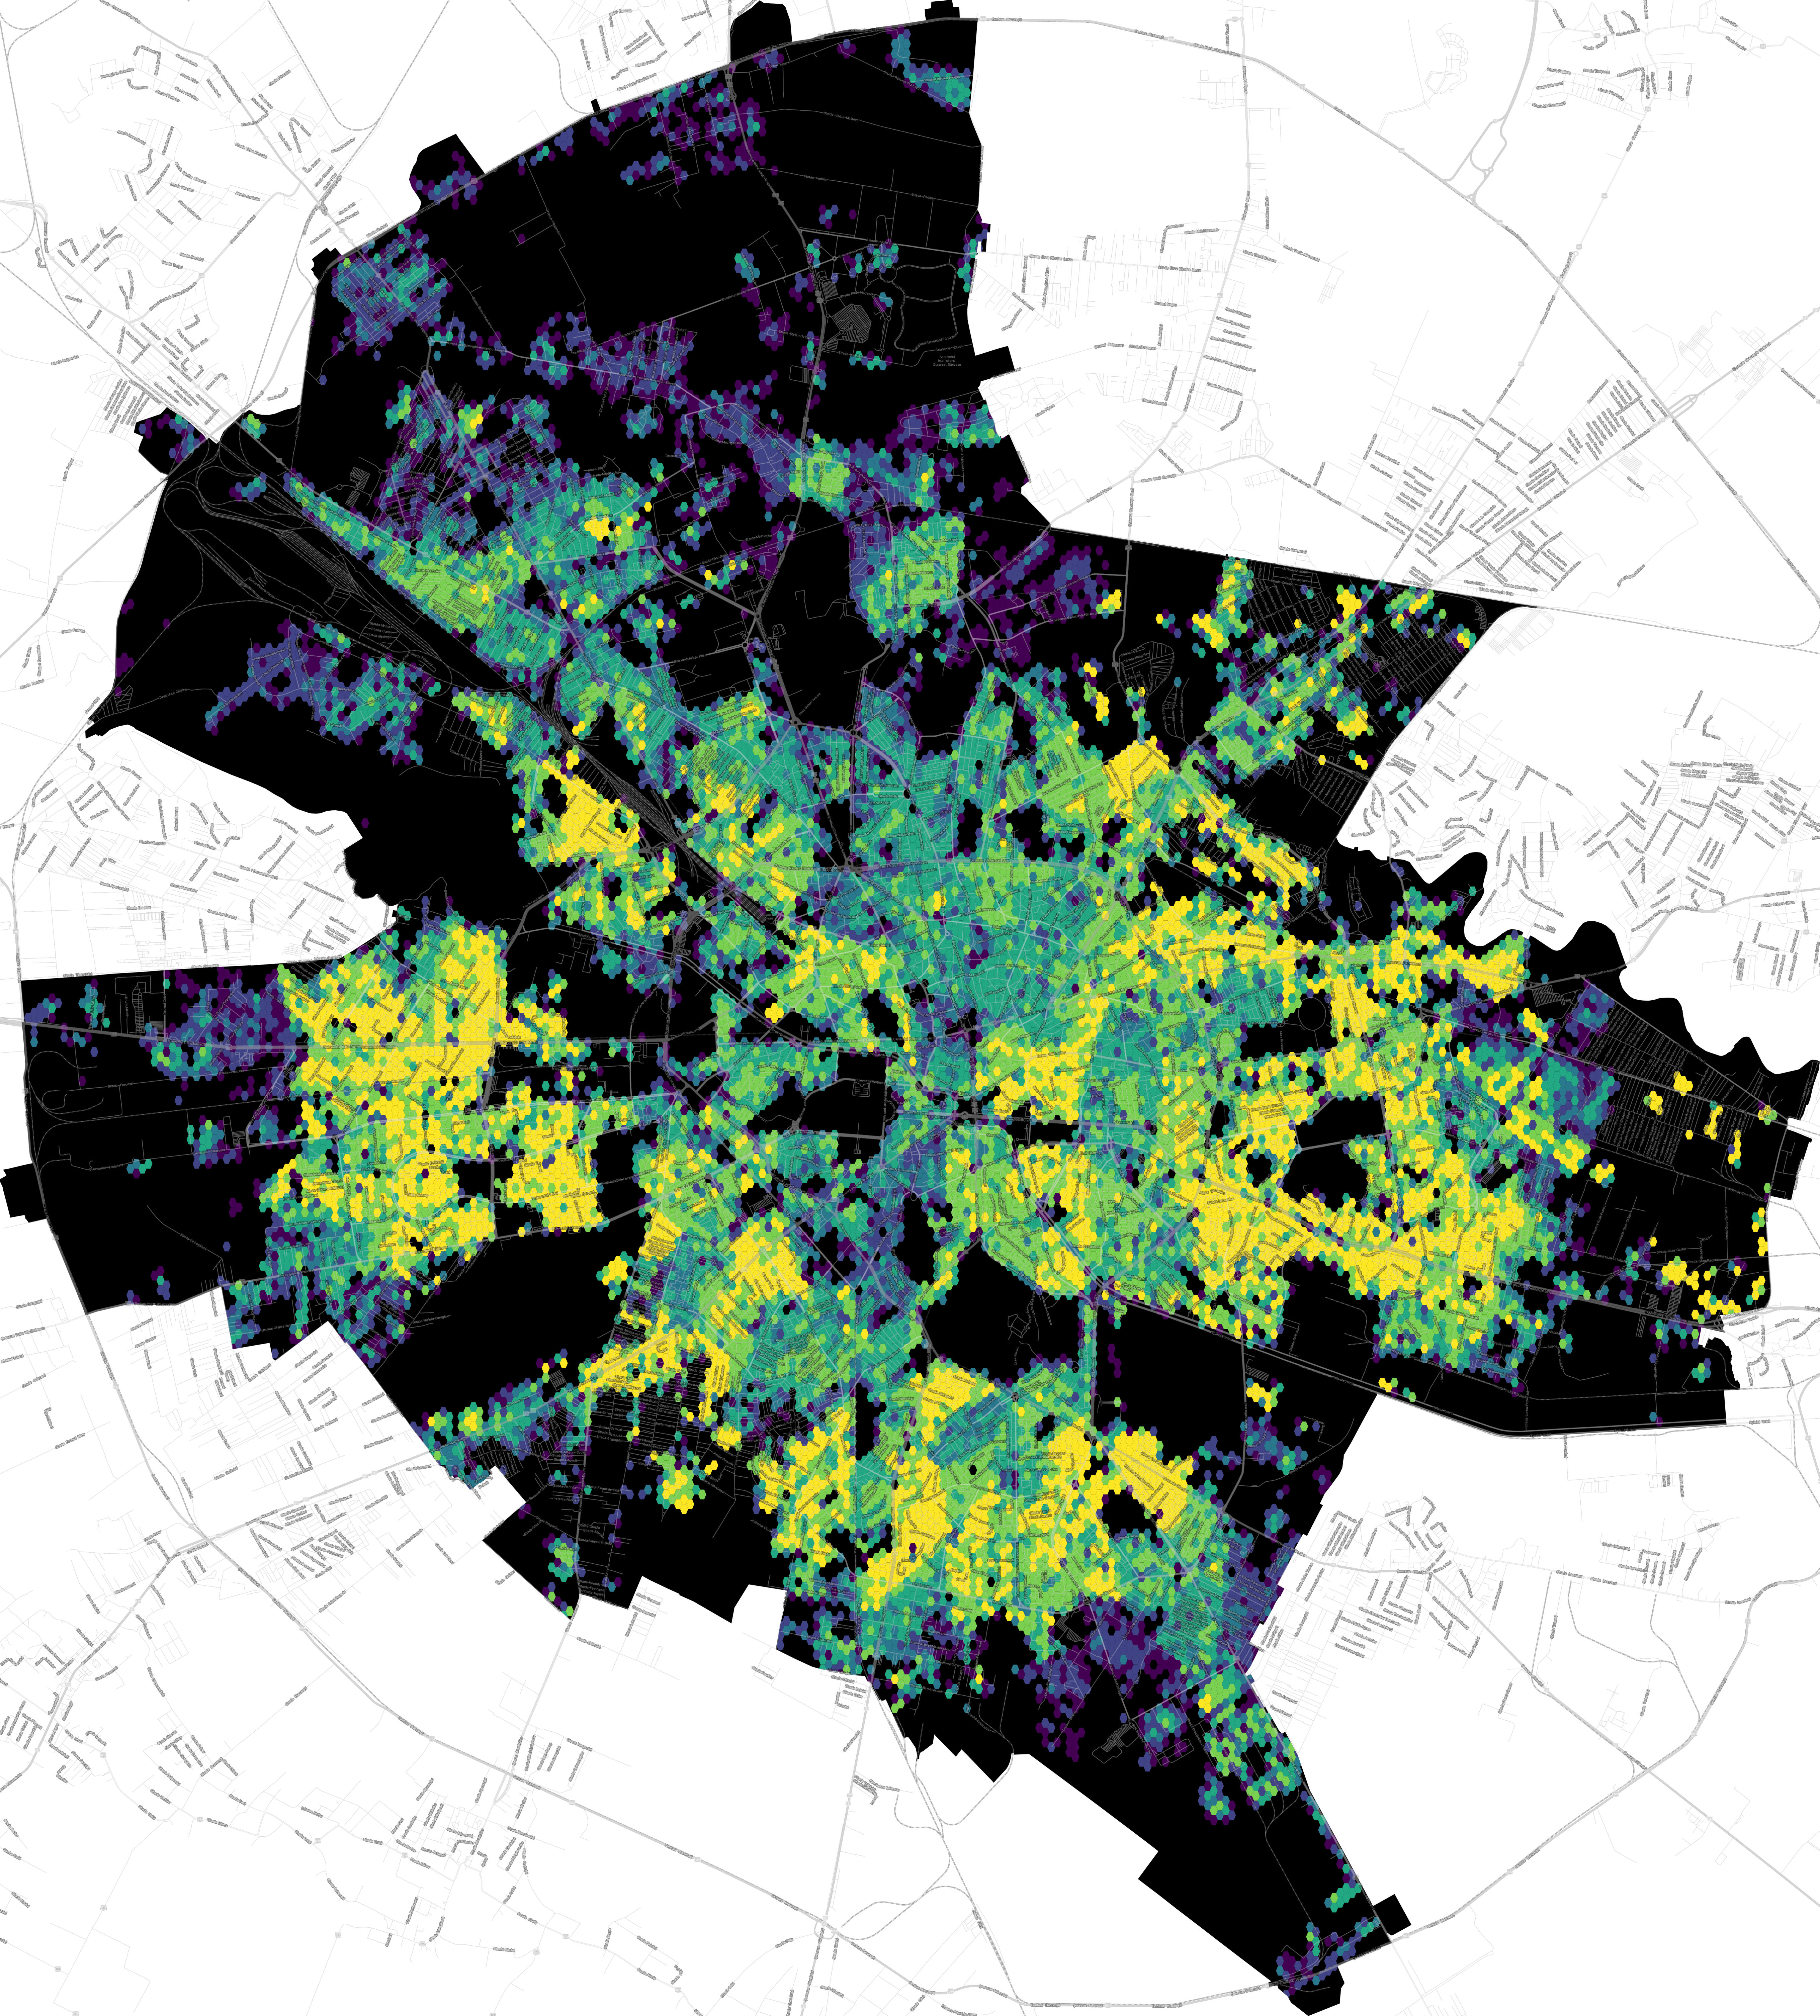
To preserve density population information, we have used a dot mapping technique, meaning that the estimated location of every adult in Bucharest is represented by a yellow dot plotted on the map, according to real density distribution, and on top, we have overlaid target areas for all Mega Image locations.
We have used 3 minutes (colored in red), 6 minutes (colored in violet) and 9 minutes (colored in blue) walking time isochrones, to emulate a detailed target area for a superstore/convenience store appropriate for Mega Image network analysis.
To preserve density population information, we have used a dot mapping technique, meaning that the estimated location of every adult in Bucharest is represented by a yellow dot plotted on the map, according to real density distribution, and on top, we have overlaid target areas for all Mega Image locations.
 For a downloadable high-quality version of the Spatial Density of Population - Bucharest map, click here (24 MB image file size).
Looking again at the detailed view of our example Dorobanti area, it is obvious from the overlapping of isochrone areas that any potential closing of (at least) one store in the area will have zero impact on the ability of the potential customers to reach any of the remaining locations in a time frame equivalent with the time needed for the former store.
End Comments
This case study is a Proof of Concept, designed to showcase the potential of Visual Analytics based on Geospatial Analysis for supporting the relevant decision-making process in a business context.
All input data used here for the Spatial Model represent public source/available data, therefore the model is inheriting the limitations and error margin of its public sources, and further work should be done to address these issues. Lack of public data on income levels at a granular level is a major obstacle in refining the demographics of the model, and this will be as well a major area for further improvement of the model.
In a real business case scenario, the model should be customized using profit/sales/costs and other financial or non-financial metrics owned by the client. Complex correlation and pattern-finding algorithms could then be run based on the geospatial and business intelligence data, generating valuable solutions for any business strategy requirements.